
Plotting velocities

Dear developer,
I didn't find a video for "plotting velocity" as "plotting height" and "plotting pressure" that are available and are excellent.
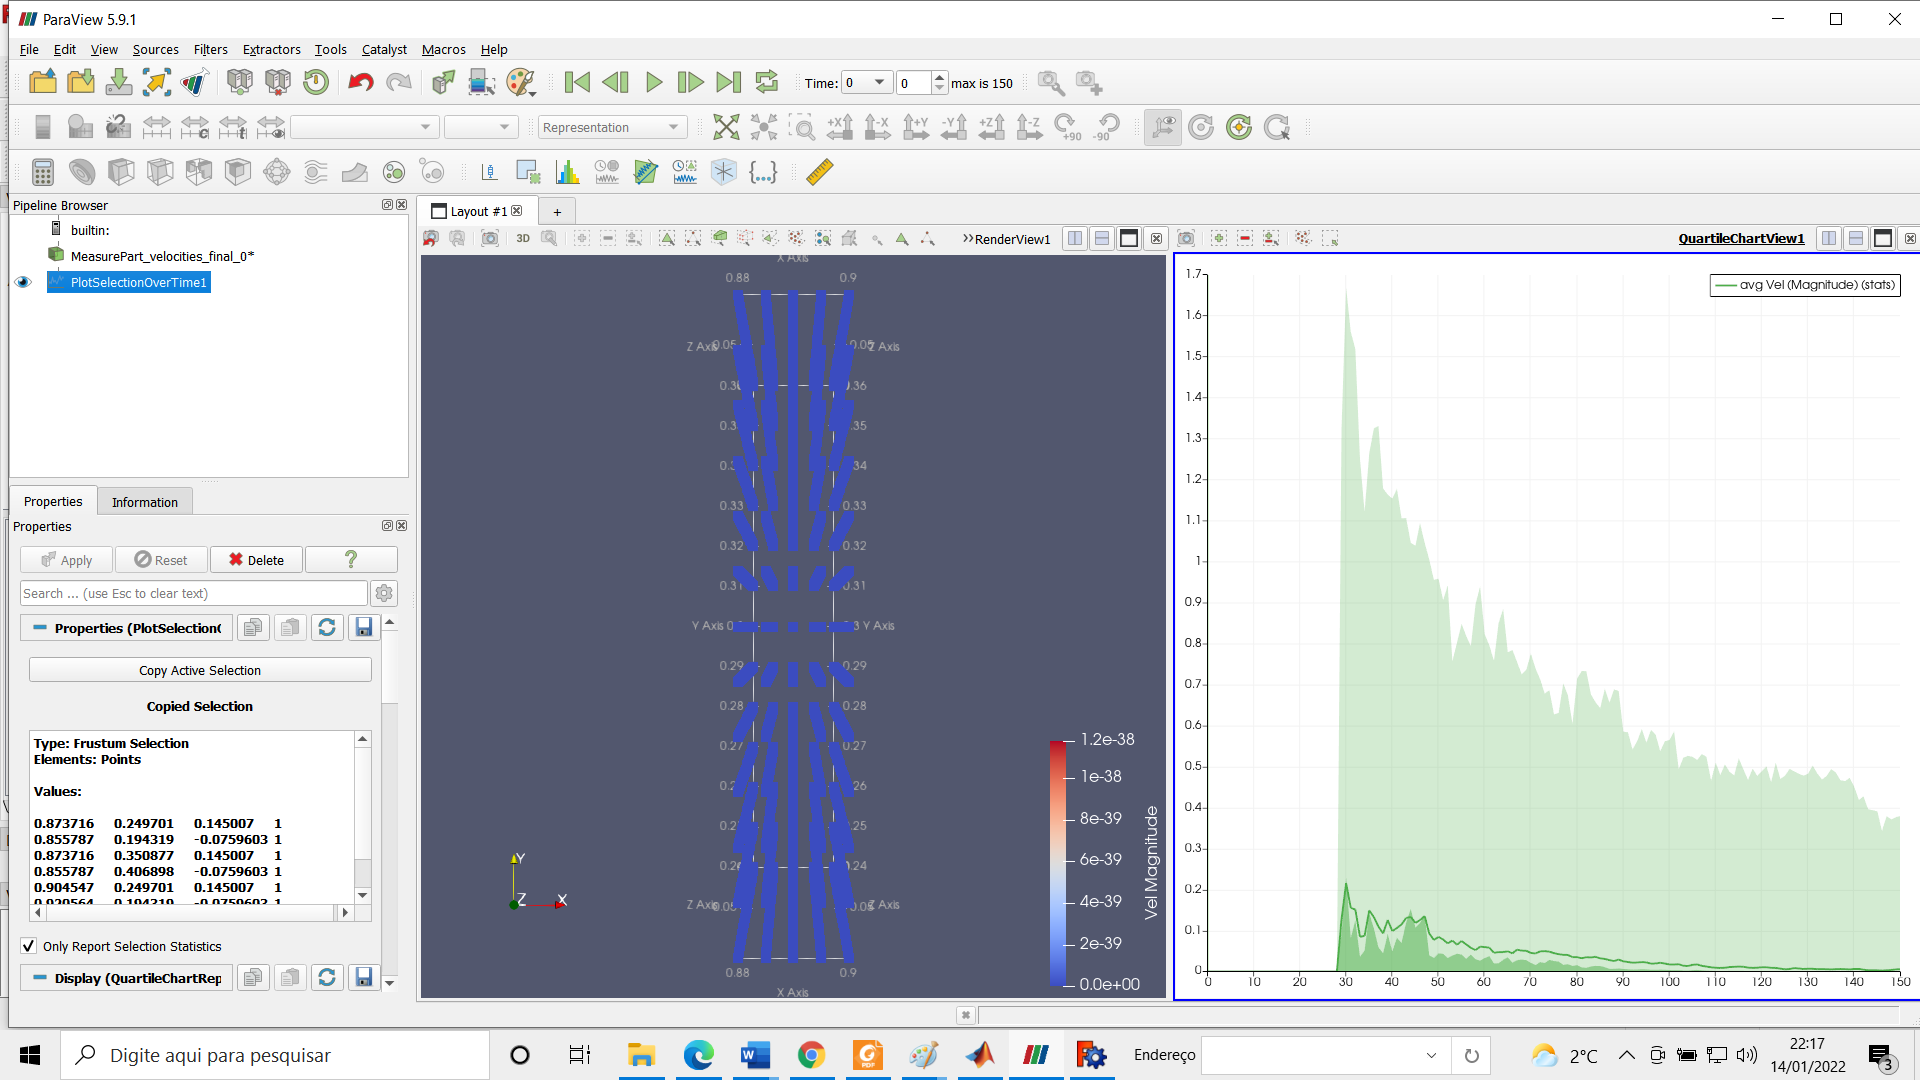
I found the following graph for the velocities, but it is a little different from that I have filtering data and plotting in Matlab.
I would like to have information about the curves plotted and how to reach them mathematically, that is, how the data was treated to generate the velocity graphs.
Best regards.
Debug Trace
| Notice |
rich is deprecated. Use FormatService::renderHtml($content, Formats\RichFormat::FORMAT_KEY) instead.

#0 [internal function]: gdn_ErrorHandler(16384, 'rich is depreca...', '/var/www/forums...', 950, Array)
#1 /var/www/forums-dual-sphysics-org/library/core/functions.general.php(950): trigger_error('rich is depreca...', 16384)
#2 /var/www/forums-dual-sphysics-org/library/core/class.format.php(1729): deprecated('rich', 'FormatService::...')
#3 /var/www/forums-dual-sphysics-org/library/core/class.format.php(1479): Gdn_Format::rich('[{"insert":"Dea...')
#4 /var/www/forums-dual-sphysics-org/applications/vanilla/controllers/class.discussioncontroller.php(197): Gdn_Format::to('[{"insert":"Dea...', 'Rich')
#5 /var/www/forums-dual-sphysics-org/applications/vanilla/controllers/class.discussioncontroller.php(402): DiscussionController->index(2216, 'x', 'p1')
#6 /var/www/forums-dual-sphysics-org/library/core/class.dispatcher.php(862): DiscussionController->comment('4898')
#7 /var/www/forums-dual-sphysics-org/library/core/class.dispatcher.php(279): Gdn_Dispatcher->dispatchController(Object(Gdn_Request), Array)
#8 /var/www/forums-dual-sphysics-org/index.php(29): Gdn_Dispatcher->dispatch()
#9 {main} |
| Notice |
rich is deprecated. Use FormatService::renderHtml($content, Formats\RichFormat::FORMAT_KEY) instead.

#0 [internal function]: gdn_ErrorHandler(16384, 'rich is depreca...', '/var/www/forums...', 950, Array)
#1 /var/www/forums-dual-sphysics-org/library/core/functions.general.php(950): trigger_error('rich is depreca...', 16384)
#2 /var/www/forums-dual-sphysics-org/library/core/class.format.php(1729): deprecated('rich', 'FormatService::...')
#3 /var/www/forums-dual-sphysics-org/library/core/class.format.php(1479): Gdn_Format::rich('[{"insert":"Dea...')
#4 /var/www/forums-dual-sphysics-org/applications/vanilla/views/discussion/helper_functions.php(24): Gdn_Format::to('[{"insert":"Dea...', 'Rich')
#5 /var/www/forums-dual-sphysics-org/applications/vanilla/views/discussion/discussion.php(89): formatBody(Object(stdClass))
#6 /var/www/forums-dual-sphysics-org/applications/vanilla/views/discussion/index.php(31): include('/var/www/forums...')
#7 /var/www/forums-dual-sphysics-org/library/core/class.controller.php(778): include('/var/www/forums...')
#8 /var/www/forums-dual-sphysics-org/library/core/class.controller.php(1382): Gdn_Controller->fetchView('', false, false)
#9 /var/www/forums-dual-sphysics-org/library/core/class.pluggable.php(217): Gdn_Controller->xRender()
#10 /var/www/forums-dual-sphysics-org/applications/vanilla/controllers/class.discussioncontroller.php(310): Gdn_Pluggable->__call('render', Array)
#11 /var/www/forums-dual-sphysics-org/applications/vanilla/controllers/class.discussioncontroller.php(402): DiscussionController->index(2216, 'x', 'p1')
#12 /var/www/forums-dual-sphysics-org/library/core/class.dispatcher.php(862): DiscussionController->comment('4898')
#13 /var/www/forums-dual-sphysics-org/library/core/class.dispatcher.php(279): Gdn_Dispatcher->dispatchController(Object(Gdn_Request), Array)
#14 /var/www/forums-dual-sphysics-org/index.php(29): Gdn_Dispatcher->dispatch()
#15 {main} |
| Notice |
rich is deprecated. Use FormatService::renderHtml($content, Formats\RichFormat::FORMAT_KEY) instead.

#0 [internal function]: gdn_ErrorHandler(16384, 'rich is depreca...', '/var/www/forums...', 950, Array)
#1 /var/www/forums-dual-sphysics-org/library/core/functions.general.php(950): trigger_error('rich is depreca...', 16384)
#2 /var/www/forums-dual-sphysics-org/library/core/class.format.php(1729): deprecated('rich', 'FormatService::...')
#3 /var/www/forums-dual-sphysics-org/library/core/class.format.php(1479): Gdn_Format::rich('[{"insert":"Usi...')
#4 /var/www/forums-dual-sphysics-org/applications/vanilla/views/discussion/helper_functions.php(24): Gdn_Format::to('[{"insert":"Usi...', 'Rich')
#5 /var/www/forums-dual-sphysics-org/applications/vanilla/views/discussion/helper_functions.php(170): formatBody(Object(stdClass))
#6 /var/www/forums-dual-sphysics-org/applications/vanilla/views/discussion/comments.php(19): writeComment(Object(stdClass), Object(DiscussionController), Object(Gdn_Session), 1)
#7 /var/www/forums-dual-sphysics-org/applications/vanilla/views/discussion/index.php(53): include('/var/www/forums...')
#8 /var/www/forums-dual-sphysics-org/library/core/class.controller.php(778): include('/var/www/forums...')
#9 /var/www/forums-dual-sphysics-org/library/core/class.controller.php(1382): Gdn_Controller->fetchView('', false, false)
#10 /var/www/forums-dual-sphysics-org/library/core/class.pluggable.php(217): Gdn_Controller->xRender()
#11 /var/www/forums-dual-sphysics-org/applications/vanilla/controllers/class.discussioncontroller.php(310): Gdn_Pluggable->__call('render', Array)
#12 /var/www/forums-dual-sphysics-org/applications/vanilla/controllers/class.discussioncontroller.php(402): DiscussionController->index(2216, 'x', 'p1')
#13 /var/www/forums-dual-sphysics-org/library/core/class.dispatcher.php(862): DiscussionController->comment('4898')
#14 /var/www/forums-dual-sphysics-org/library/core/class.dispatcher.php(279): Gdn_Dispatcher->dispatchController(Object(Gdn_Request), Array)
#15 /var/www/forums-dual-sphysics-org/index.php(29): Gdn_Dispatcher->dispatch()
#16 {main} |
Comments
Using MeasureTool you can generate CSV files with velocity.... is that your question? maybe you ask sthg different, sorry