
IsoSurface to generate a contour ?

I would really like to generate contour plots as:
http://people.cst.cmich.edu/yelam1k/asee/proceedings/2018/1/36.pdf
Can this be done in anyway in DualSPHysics?
Kind regards
Debug Trace
| Notice |
rich is deprecated. Use FormatService::renderHtml($content, Formats\RichFormat::FORMAT_KEY) instead.

#0 [internal function]: gdn_ErrorHandler(16384, 'rich is depreca...', '/var/www/forums...', 950, Array)
#1 /var/www/forums-dual-sphysics-org/library/core/functions.general.php(950): trigger_error('rich is depreca...', 16384)
#2 /var/www/forums-dual-sphysics-org/library/core/class.format.php(1729): deprecated('rich', 'FormatService::...')
#3 /var/www/forums-dual-sphysics-org/library/core/class.format.php(1479): Gdn_Format::rich('[{"insert":"I w...')
#4 /var/www/forums-dual-sphysics-org/applications/vanilla/controllers/class.discussioncontroller.php(197): Gdn_Format::to('[{"insert":"I w...', 'Rich')
#5 /var/www/forums-dual-sphysics-org/applications/vanilla/controllers/class.discussioncontroller.php(402): DiscussionController->index(1948, 'x', 'p1')
#6 /var/www/forums-dual-sphysics-org/library/core/class.dispatcher.php(862): DiscussionController->comment('4167')
#7 /var/www/forums-dual-sphysics-org/library/core/class.dispatcher.php(279): Gdn_Dispatcher->dispatchController(Object(Gdn_Request), Array)
#8 /var/www/forums-dual-sphysics-org/index.php(29): Gdn_Dispatcher->dispatch()
#9 {main} |
| Notice |
rich is deprecated. Use FormatService::renderHtml($content, Formats\RichFormat::FORMAT_KEY) instead.

#0 [internal function]: gdn_ErrorHandler(16384, 'rich is depreca...', '/var/www/forums...', 950, Array)
#1 /var/www/forums-dual-sphysics-org/library/core/functions.general.php(950): trigger_error('rich is depreca...', 16384)
#2 /var/www/forums-dual-sphysics-org/library/core/class.format.php(1729): deprecated('rich', 'FormatService::...')
#3 /var/www/forums-dual-sphysics-org/library/core/class.format.php(1479): Gdn_Format::rich('[{"insert":"I w...')
#4 /var/www/forums-dual-sphysics-org/applications/vanilla/views/discussion/helper_functions.php(24): Gdn_Format::to('[{"insert":"I w...', 'Rich')
#5 /var/www/forums-dual-sphysics-org/applications/vanilla/views/discussion/discussion.php(89): formatBody(Object(stdClass))
#6 /var/www/forums-dual-sphysics-org/applications/vanilla/views/discussion/index.php(31): include('/var/www/forums...')
#7 /var/www/forums-dual-sphysics-org/library/core/class.controller.php(778): include('/var/www/forums...')
#8 /var/www/forums-dual-sphysics-org/library/core/class.controller.php(1382): Gdn_Controller->fetchView('', false, false)
#9 /var/www/forums-dual-sphysics-org/library/core/class.pluggable.php(217): Gdn_Controller->xRender()
#10 /var/www/forums-dual-sphysics-org/applications/vanilla/controllers/class.discussioncontroller.php(310): Gdn_Pluggable->__call('render', Array)
#11 /var/www/forums-dual-sphysics-org/applications/vanilla/controllers/class.discussioncontroller.php(402): DiscussionController->index(1948, 'x', 'p1')
#12 /var/www/forums-dual-sphysics-org/library/core/class.dispatcher.php(862): DiscussionController->comment('4167')
#13 /var/www/forums-dual-sphysics-org/library/core/class.dispatcher.php(279): Gdn_Dispatcher->dispatchController(Object(Gdn_Request), Array)
#14 /var/www/forums-dual-sphysics-org/index.php(29): Gdn_Dispatcher->dispatch()
#15 {main} |
| Notice |
rich is deprecated. Use FormatService::renderHtml($content, Formats\RichFormat::FORMAT_KEY) instead.

#0 [internal function]: gdn_ErrorHandler(16384, 'rich is depreca...', '/var/www/forums...', 950, Array)
#1 /var/www/forums-dual-sphysics-org/library/core/functions.general.php(950): trigger_error('rich is depreca...', 16384)
#2 /var/www/forums-dual-sphysics-org/library/core/class.format.php(1729): deprecated('rich', 'FormatService::...')
#3 /var/www/forums-dual-sphysics-org/library/core/class.format.php(1479): Gdn_Format::rich('[{"insert":"Yes...')
#4 /var/www/forums-dual-sphysics-org/applications/vanilla/views/discussion/helper_functions.php(24): Gdn_Format::to('[{"insert":"Yes...', 'Rich')
#5 /var/www/forums-dual-sphysics-org/applications/vanilla/views/discussion/helper_functions.php(170): formatBody(Object(stdClass))
#6 /var/www/forums-dual-sphysics-org/applications/vanilla/views/discussion/comments.php(19): writeComment(Object(stdClass), Object(DiscussionController), Object(Gdn_Session), 1)
#7 /var/www/forums-dual-sphysics-org/applications/vanilla/views/discussion/index.php(53): include('/var/www/forums...')
#8 /var/www/forums-dual-sphysics-org/library/core/class.controller.php(778): include('/var/www/forums...')
#9 /var/www/forums-dual-sphysics-org/library/core/class.controller.php(1382): Gdn_Controller->fetchView('', false, false)
#10 /var/www/forums-dual-sphysics-org/library/core/class.pluggable.php(217): Gdn_Controller->xRender()
#11 /var/www/forums-dual-sphysics-org/applications/vanilla/controllers/class.discussioncontroller.php(310): Gdn_Pluggable->__call('render', Array)
#12 /var/www/forums-dual-sphysics-org/applications/vanilla/controllers/class.discussioncontroller.php(402): DiscussionController->index(1948, 'x', 'p1')
#13 /var/www/forums-dual-sphysics-org/library/core/class.dispatcher.php(862): DiscussionController->comment('4167')
#14 /var/www/forums-dual-sphysics-org/library/core/class.dispatcher.php(279): Gdn_Dispatcher->dispatchController(Object(Gdn_Request), Array)
#15 /var/www/forums-dual-sphysics-org/index.php(29): Gdn_Dispatcher->dispatch()
#16 {main} |
| Notice |
rich is deprecated. Use FormatService::renderHtml($content, Formats\RichFormat::FORMAT_KEY) instead.

#0 [internal function]: gdn_ErrorHandler(16384, 'rich is depreca...', '/var/www/forums...', 950, Array)
#1 /var/www/forums-dual-sphysics-org/library/core/functions.general.php(950): trigger_error('rich is depreca...', 16384)
#2 /var/www/forums-dual-sphysics-org/library/core/class.format.php(1729): deprecated('rich', 'FormatService::...')
#3 /var/www/forums-dual-sphysics-org/library/core/class.format.php(1479): Gdn_Format::rich('[{"insert":"Tha...')
#4 /var/www/forums-dual-sphysics-org/applications/vanilla/views/discussion/helper_functions.php(24): Gdn_Format::to('[{"insert":"Tha...', 'Rich')
#5 /var/www/forums-dual-sphysics-org/applications/vanilla/views/discussion/helper_functions.php(170): formatBody(Object(stdClass))
#6 /var/www/forums-dual-sphysics-org/applications/vanilla/views/discussion/comments.php(19): writeComment(Object(stdClass), Object(DiscussionController), Object(Gdn_Session), 2)
#7 /var/www/forums-dual-sphysics-org/applications/vanilla/views/discussion/index.php(53): include('/var/www/forums...')
#8 /var/www/forums-dual-sphysics-org/library/core/class.controller.php(778): include('/var/www/forums...')
#9 /var/www/forums-dual-sphysics-org/library/core/class.controller.php(1382): Gdn_Controller->fetchView('', false, false)
#10 /var/www/forums-dual-sphysics-org/library/core/class.pluggable.php(217): Gdn_Controller->xRender()
#11 /var/www/forums-dual-sphysics-org/applications/vanilla/controllers/class.discussioncontroller.php(310): Gdn_Pluggable->__call('render', Array)
#12 /var/www/forums-dual-sphysics-org/applications/vanilla/controllers/class.discussioncontroller.php(402): DiscussionController->index(1948, 'x', 'p1')
#13 /var/www/forums-dual-sphysics-org/library/core/class.dispatcher.php(862): DiscussionController->comment('4167')
#14 /var/www/forums-dual-sphysics-org/library/core/class.dispatcher.php(279): Gdn_Dispatcher->dispatchController(Object(Gdn_Request), Array)
#15 /var/www/forums-dual-sphysics-org/index.php(29): Gdn_Dispatcher->dispatch()
#16 {main} |
| Notice |
rich is deprecated. Use FormatService::renderHtml($content, Formats\RichFormat::FORMAT_KEY) instead.

#0 [internal function]: gdn_ErrorHandler(16384, 'rich is depreca...', '/var/www/forums...', 950, Array)
#1 /var/www/forums-dual-sphysics-org/library/core/functions.general.php(950): trigger_error('rich is depreca...', 16384)
#2 /var/www/forums-dual-sphysics-org/library/core/class.format.php(1729): deprecated('rich', 'FormatService::...')
#3 /var/www/forums-dual-sphysics-org/library/core/class.format.php(1479): Gdn_Format::rich('[{"insert":"Her...')
#4 /var/www/forums-dual-sphysics-org/applications/vanilla/views/discussion/helper_functions.php(24): Gdn_Format::to('[{"insert":"Her...', 'Rich')
#5 /var/www/forums-dual-sphysics-org/applications/vanilla/views/discussion/helper_functions.php(170): formatBody(Object(stdClass))
#6 /var/www/forums-dual-sphysics-org/applications/vanilla/views/discussion/comments.php(19): writeComment(Object(stdClass), Object(DiscussionController), Object(Gdn_Session), 3)
#7 /var/www/forums-dual-sphysics-org/applications/vanilla/views/discussion/index.php(53): include('/var/www/forums...')
#8 /var/www/forums-dual-sphysics-org/library/core/class.controller.php(778): include('/var/www/forums...')
#9 /var/www/forums-dual-sphysics-org/library/core/class.controller.php(1382): Gdn_Controller->fetchView('', false, false)
#10 /var/www/forums-dual-sphysics-org/library/core/class.pluggable.php(217): Gdn_Controller->xRender()
#11 /var/www/forums-dual-sphysics-org/applications/vanilla/controllers/class.discussioncontroller.php(310): Gdn_Pluggable->__call('render', Array)
#12 /var/www/forums-dual-sphysics-org/applications/vanilla/controllers/class.discussioncontroller.php(402): DiscussionController->index(1948, 'x', 'p1')
#13 /var/www/forums-dual-sphysics-org/library/core/class.dispatcher.php(862): DiscussionController->comment('4167')
#14 /var/www/forums-dual-sphysics-org/library/core/class.dispatcher.php(279): Gdn_Dispatcher->dispatchController(Object(Gdn_Request), Array)
#15 /var/www/forums-dual-sphysics-org/index.php(29): Gdn_Dispatcher->dispatch()
#16 {main} |
| Notice |
rich is deprecated. Use FormatService::renderHtml($content, Formats\RichFormat::FORMAT_KEY) instead.

#0 [internal function]: gdn_ErrorHandler(16384, 'rich is depreca...', '/var/www/forums...', 950, Array)
#1 /var/www/forums-dual-sphysics-org/library/core/functions.general.php(950): trigger_error('rich is depreca...', 16384)
#2 /var/www/forums-dual-sphysics-org/library/core/class.format.php(1729): deprecated('rich', 'FormatService::...')
#3 /var/www/forums-dual-sphysics-org/library/core/class.format.php(1479): Gdn_Format::rich('[{"insert":"Tha...')
#4 /var/www/forums-dual-sphysics-org/applications/vanilla/views/discussion/helper_functions.php(24): Gdn_Format::to('[{"insert":"Tha...', 'Rich')
#5 /var/www/forums-dual-sphysics-org/applications/vanilla/views/discussion/helper_functions.php(170): formatBody(Object(stdClass))
#6 /var/www/forums-dual-sphysics-org/applications/vanilla/views/discussion/comments.php(19): writeComment(Object(stdClass), Object(DiscussionController), Object(Gdn_Session), 4)
#7 /var/www/forums-dual-sphysics-org/applications/vanilla/views/discussion/index.php(53): include('/var/www/forums...')
#8 /var/www/forums-dual-sphysics-org/library/core/class.controller.php(778): include('/var/www/forums...')
#9 /var/www/forums-dual-sphysics-org/library/core/class.controller.php(1382): Gdn_Controller->fetchView('', false, false)
#10 /var/www/forums-dual-sphysics-org/library/core/class.pluggable.php(217): Gdn_Controller->xRender()
#11 /var/www/forums-dual-sphysics-org/applications/vanilla/controllers/class.discussioncontroller.php(310): Gdn_Pluggable->__call('render', Array)
#12 /var/www/forums-dual-sphysics-org/applications/vanilla/controllers/class.discussioncontroller.php(402): DiscussionController->index(1948, 'x', 'p1')
#13 /var/www/forums-dual-sphysics-org/library/core/class.dispatcher.php(862): DiscussionController->comment('4167')
#14 /var/www/forums-dual-sphysics-org/library/core/class.dispatcher.php(279): Gdn_Dispatcher->dispatchController(Object(Gdn_Request), Array)
#15 /var/www/forums-dual-sphysics-org/index.php(29): Gdn_Dispatcher->dispatch()
#16 {main} |
| Notice |
rich is deprecated. Use FormatService::renderHtml($content, Formats\RichFormat::FORMAT_KEY) instead.

#0 [internal function]: gdn_ErrorHandler(16384, 'rich is depreca...', '/var/www/forums...', 950, Array)
#1 /var/www/forums-dual-sphysics-org/library/core/functions.general.php(950): trigger_error('rich is depreca...', 16384)
#2 /var/www/forums-dual-sphysics-org/library/core/class.format.php(1729): deprecated('rich', 'FormatService::...')
#3 /var/www/forums-dual-sphysics-org/library/core/class.format.php(1479): Gdn_Format::rich('[{"insert":{"em...')
#4 /var/www/forums-dual-sphysics-org/applications/vanilla/views/discussion/helper_functions.php(24): Gdn_Format::to('[{"insert":{"em...', 'Rich')
#5 /var/www/forums-dual-sphysics-org/applications/vanilla/views/discussion/helper_functions.php(170): formatBody(Object(stdClass))
#6 /var/www/forums-dual-sphysics-org/applications/vanilla/views/discussion/comments.php(19): writeComment(Object(stdClass), Object(DiscussionController), Object(Gdn_Session), 5)
#7 /var/www/forums-dual-sphysics-org/applications/vanilla/views/discussion/index.php(53): include('/var/www/forums...')
#8 /var/www/forums-dual-sphysics-org/library/core/class.controller.php(778): include('/var/www/forums...')
#9 /var/www/forums-dual-sphysics-org/library/core/class.controller.php(1382): Gdn_Controller->fetchView('', false, false)
#10 /var/www/forums-dual-sphysics-org/library/core/class.pluggable.php(217): Gdn_Controller->xRender()
#11 /var/www/forums-dual-sphysics-org/applications/vanilla/controllers/class.discussioncontroller.php(310): Gdn_Pluggable->__call('render', Array)
#12 /var/www/forums-dual-sphysics-org/applications/vanilla/controllers/class.discussioncontroller.php(402): DiscussionController->index(1948, 'x', 'p1')
#13 /var/www/forums-dual-sphysics-org/library/core/class.dispatcher.php(862): DiscussionController->comment('4167')
#14 /var/www/forums-dual-sphysics-org/library/core/class.dispatcher.php(279): Gdn_Dispatcher->dispatchController(Object(Gdn_Request), Array)
#15 /var/www/forums-dual-sphysics-org/index.php(29): Gdn_Dispatcher->dispatch()
#16 {main} |
Comments
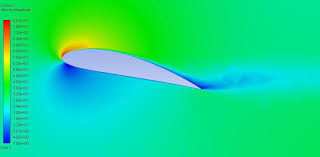
Yes, I manage to make contour plots with the MeasureTool of DualSPHysics. With measure points on a rectangular plane with a high enough resolution these kinds of plots are possible. I wrote a Matlab script that generates a 'fpoints.txt' file (input for the MeasureTool) with all point coordinates in a plane (or planes) by giving it: [X_min, X_max], [Y_min, Y_max] (and [Z_min, Z_max]) and resolution steps Δx and Δy (Δz). I attach the Matlab code as a .txt file (the .m extension is not supportet here) and you can copy it into a Matlab script. You can make an arbitrary amount of coordinates within seconds with this, but I suggest not making more then 10^6 due to the MeasureTool runtime.
For example, I made a contour plot on a 1m x 2m plane with a resolution Δx = Δy = 0.002 (≈5*10^5 coordinate points). The result is this:
I hope you have access to Matlab, otherwise you can re-write the code into a python script (or I can do it for you).
Thank you @Hannes ! That is so nice.
Would you mind doing a Python version if you have time? I think it would benefit alot of us, both students and companies, and I must say the picture you made looks great!
I have used Matlab previously a lot, but I would prefer a Python version, due to the ease of sharing etc. Perhaps this / a similar approach could be bundled into DualSPHysics @Alex ?
Kind regards, Ahmed
Here is the same code in Python. In the first 10 lines you can specify the domain (X_min/max, Y_min/max, Z_min/max) and the resolution steps (Δx, Δy, Δz). It produces the same 'fpoints.txt' file as the Matlab code above, which is a list of all intersecting coordinates from the specified domain. In conjunction with the MeasureTool one can evaluate the flow variables in a plane (or planes) and generate contour plots. (Again, I am uploading the python code as a .txt file, the .py extension is not supported):
Have fun,
Hannes
Thank you very much @Hannes !
I wish I could upvote posts on this forum :-)
I look forward to playing around with it and using it with the measure tool.
Kind regards
Hi there,
I am using 2 ways to plot contours -
Firstly, I have used the clip function to cut up a neat segment and plotted the velocity magnitude to get a contour in ParaView. This is a 3D segment, viewed in the Z- direction.
Another way would be to use a measuretool, to extract a surface-like gauge segment from the grid of points option in VTK format and just import it in Paraview to view the contour. After that, we then use filters in Paraview if we wish to create a more uniform surface from the velocity data points.